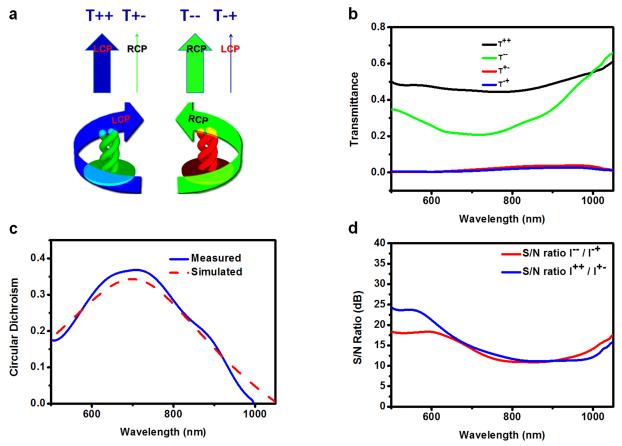
Figure 3. Circular dichroism and S/N ratio.
(a) Schematic representation to indicate the handedness of incident and transmitted circular polarization in the experimental measurements.(b) Measured transmission spectra (T++, T+− and T−−, T−+) for RCP and LCP incident light, respectively.(c) Measured (solid line) and simulated (dashed line) circular dichroism (CD=(T++ − T−−)/(T+++ T−−)) with peak value of 37% and broadband in the visible range. The simulated curve, obtained by varying the Pt content with dielectric function described by the Drude model, is calculated by considering an effective Pt content of 40%, as expected for FIBID technique33. (d) Measured S/N ratio, defined as I++/I+− (I−−/I−+).

