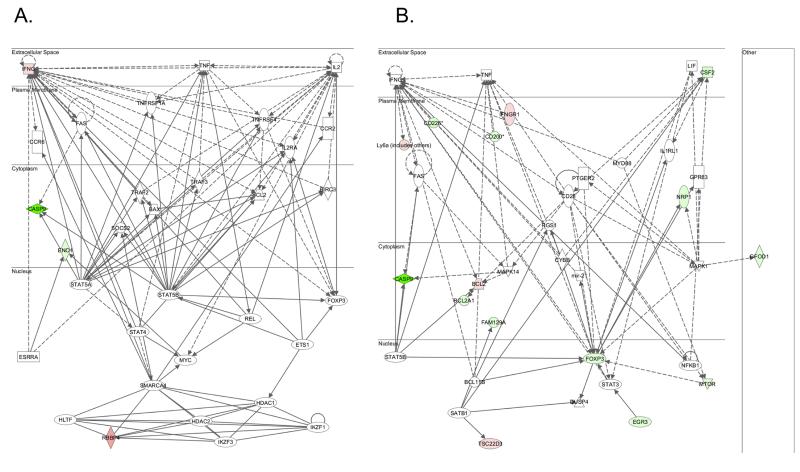
Figure 4. Gene network of differentially expressed genes in CD4+ T cells between BDC-Idd9.905 and BDC mice.
The 55 genes and 80 genes that were differentially expressed in ex vivo (A) and p79-stimulated (B) CD4+ T cells between BDC-Idd9.905 and BDC mice, respectively were subjected to Ingenuity Pathway analysis. The most significant molecular network for each gene set is shown. Nodes represent gene products and biological relationships between two nodes are represented as a line (direct interaction: solid line; indirect interaction: broken line). Green and red nodes indicate elevated and decreased expression levels, respectively.

