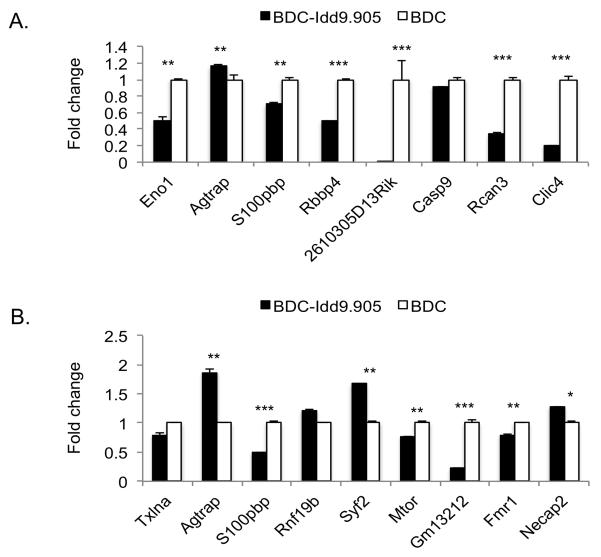
Figure 5. Validation of differential expression of selected genes by quantitative PCR.
Selected genes that showed differential expression (FC >1.4, p<0.05) in microarray analysis of ex vivo (A) and p79-stimulated (B) CD4+ T cells between BDC-Idd9.905 and BDC mice were validated by RT-qPCR. Data were normalized to 18S rRNA expression and shown as mean fold change in BDC-Idd9.905 samples relative to the mean fold change in BDC samples ± S.D. (error bars). *p<0.05, **p<0.01, ***p<0.001 (Student’s t test).

