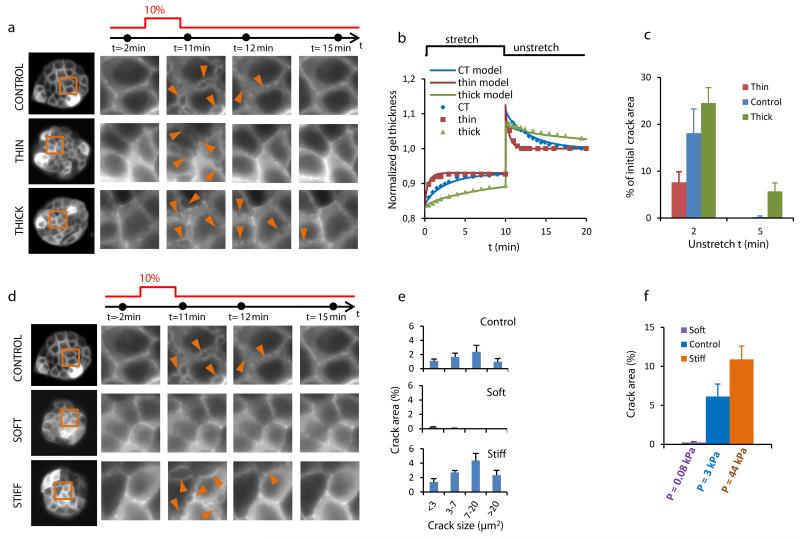
Figure 4. The origin of cracks is hydraulic.
a, (left) Clusters of MDCK cells expressing LifeAct-GFP on PAA hydrogels of different thickness. (right) Time-lapse evolution of the regions highlighted in orange on left panels before and after a 10 min pulse of 10% biaxial stretch. The acquisition time of each snap shot is marked by a black dot on the time axis (top). Arrowheads point to a subset of cracks. b, Time evolution of the thickness of three PAA hydrogels of same stiffness (12 kPa) but different initial thickness (CT=168 μm, thin=54 μm, thick=358 μm) during and after application of a 10 min stretch pulse. Solid lines are fits of the poroelastic model described in Supplementary Note 1. c, Percentage of the initial crack area that remains open 2 and 5 min after unstretching hydrogels of different thickness (n=4 per condition, CT=156.3± 9.8 μm, thin=59.3±3.8 μm, thick=345.0±15.3 μm, mean±SEM). d, (left) Clusters of MDCK expressing LifeAct-GFP on PAA hydrogels of same initial thickness but different stiffness (0.2, 12, 200kPa). (right) Time-lapse evolution of the regions highlighted on left panels before and after a 10 min 10% biaxial stretch. e, Distribution of crack size 45 s after unstretch in clusters attached to hydrogels of different stiffness (0.2kPa, 12kPa and 200kPa). f, Percentage of crack area 45s after stretch cessation in clusters attached to substrates of different stiffness. Values on the x-axis are hydraulic pressures at the cell-gel interface estimated from the poroelastic theory (Supplementary Note 1). Error bars show SEM. Epithelial clusters are 80 μm in diameter.

