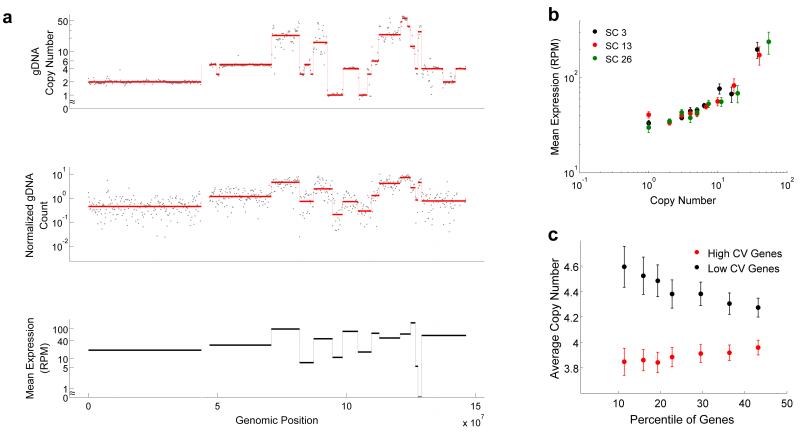
Figure 3.
Applying DR-Seq to the SK-BR-3 cell line to understand how copy number variations affect gene expression in single cells. (a) Top panel shows raw gDNA data (dots) and different copy numbers (red line) identified using the CBS algorithm26 for Chr 8 in bulk sequencing data. The middle panel shows raw data (dots) and median read counts (red line) identified using CBS for one single cell (SC13). Visual comparison of the top and middle panels show that most breakpoints are reliably detected in single cells and patterns of level changes between bulk and single cell gDNA sequencing are well correlated. The median read depths for each segment in single cells and the bulk copy numbers are used to estimate copy number variations in single cells (Supplementary Note). For each median level identified from the single cell gDNA data (middle panel), mean expression of genes within each level was calculated (black lines in lower panel). The lower panel shows that the mean expression of genes within each segment correlates well with the median gDNA levels. (b) Genome-wide quantification of mean expression of genes within different copy number regions shows a monotonic increase in average expression with increase in copy number for 3 single cells (also see Supplementary Fig. 25). (c) For a large range of mean expressions (5-400 RPM), genes exhibiting the highest and lowest noise (quantified as coefficient of variation, or CV) were identified. The x-axis shows the percentage of most noisy and least noisy genes that were considered in the analysis. The data shows that the noisiest genes are associated with low copy number regions and vice versa (also see Supplementary Fig. 27). Error bars represent standard error in estimating the mean obtained by bootstrapping the data.

