
Figure 1.
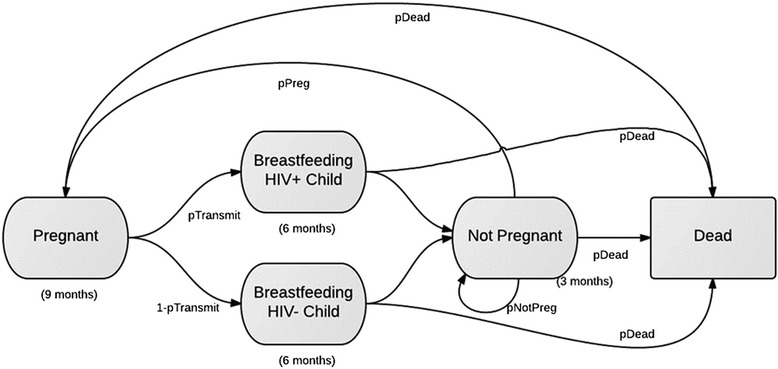
State transition model overview. A schematic diagram for the state transition model is given. Each oval represents a health state in which a woman can exist. She remains in a state for the period of time indicated underneath each oval. Each arrow represents a transition to the next state, which occurs with the probability indicated below each arrow.