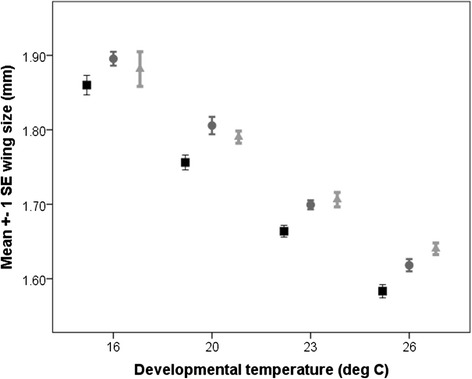
Figure 2.

Mean wing size of three populations at four temperatures. Mean wing size (mm ± 1 se) scored across four developmental temperatures in three populations of flies. Lewistown (northern population) = black lines/square markers; Show Low (southern population) = grey lines/circle; Chiricahua (southernmost population) = grey lines/triangle markers.
