
Figure 3.
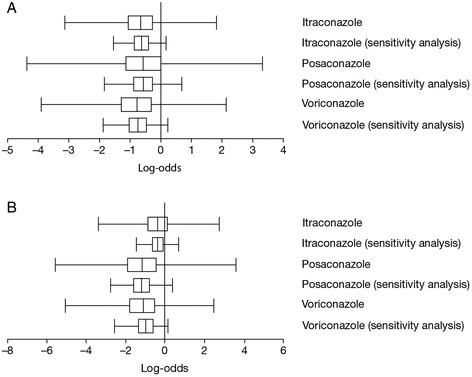
Treatment effect of antifungal agents on A) proven/probable invasive fungal infection (IFI) and B) proven/probable invasive aspergillosis (IA) at 180 days, compared between the base-case mixed treatment comparison (MTC) and the sensitivity analysis MTC using an empirical prior, expressed in log odds. Estimates less than zero indicate a reduced probability of IFI relative to fluconazole. The vertical bar of the box plot represents the posterior median value (probability <50%); the outer limits of the box plot represent the posterior interquartile range (probability 25%–75%); whiskers represent the most extreme Markov Chain Monte Carlo values of the posterior no more than 1.5 times the width of the interquartile range above or below the upper or lower bounds of the interquartile range.