. 2015 Mar;6(Suppl 1):S5–S11. doi: 10.4103/0976-237X.152930
Copyright: © Contemporary Clinical Dentistry
This is an open-access article distributed under the terms of the Creative Commons Attribution-Noncommercial-Share Alike 3.0 Unported, which permits unrestricted use, distribution, and reproduction in any medium, provided the original work is properly cited.
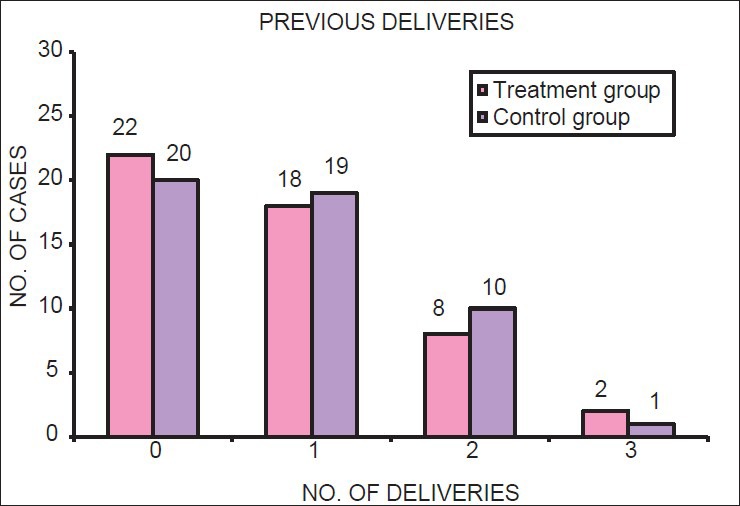
Figure 3.

Parity of mothers in treatment and control group
