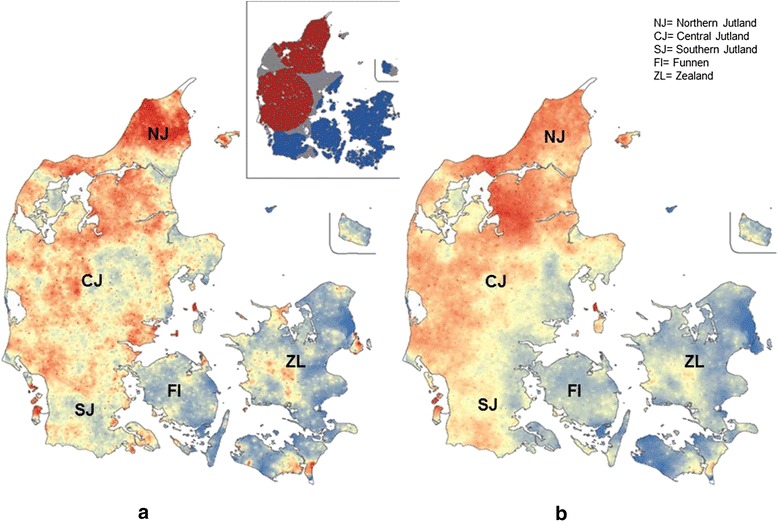
Figure 2.

Heat maps of observed (a) and predicted (b) status of Fasciola hepatica infection in Danish cattle herds (n = 16,626) where areas coloured in red and blue indicate hot (RR ≥ 1.0) and cold spots (RR < 1.0), respectively. The insert in Figure 2 a shows a SatScan map of significant spatial local clustering of infected (red) and non-infected (blue) herds.
