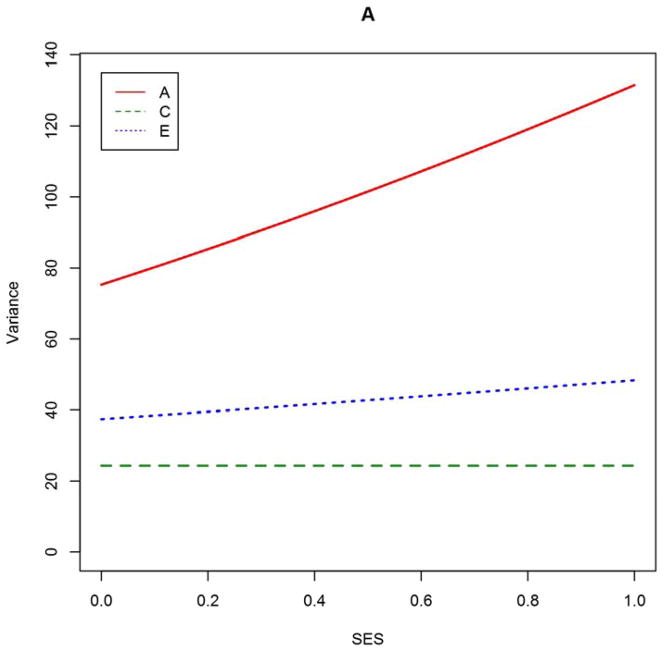
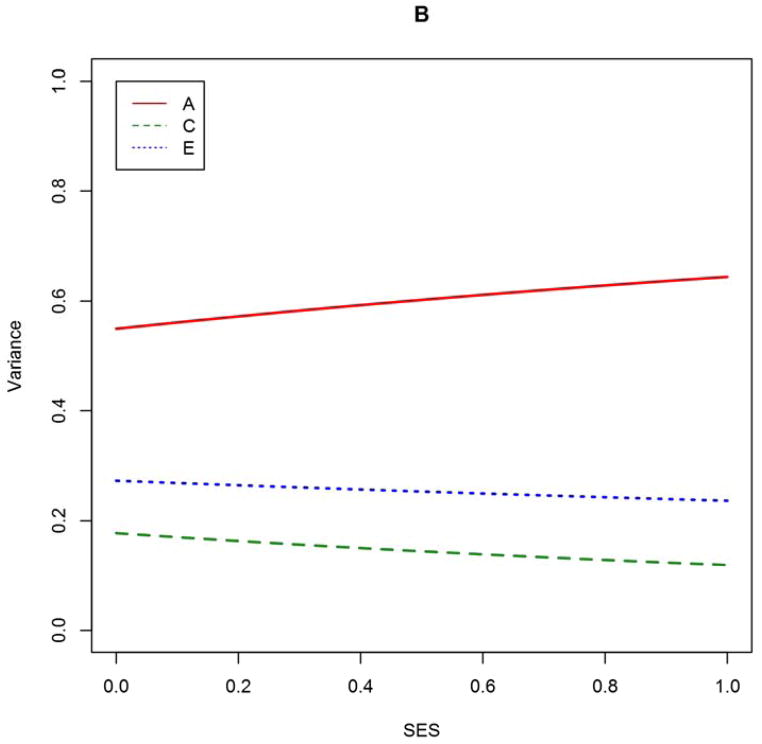
Figure 2. Biometric variance components (A) and variance proportions (B) as function of SES, based on estimates from best-approximating Model #15.
At a given point on the abscissa in panel B, the ordinate positions of each curve sum to unity. SES is a composite of parental educational attainment, parental occupational status, and household income, transformed to cumulative proportions (mean = 0.58, SD = 0.24). Model #15 included A × SES and E × SES effects.


