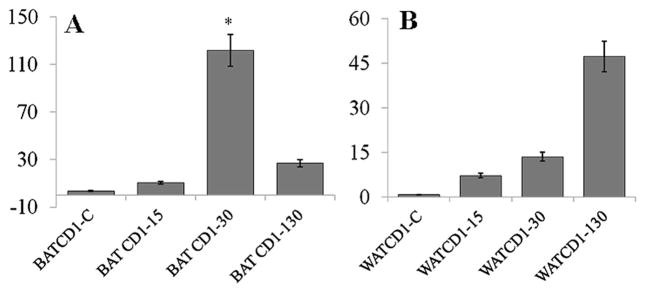
Fig. 2.

Bar graphs showing the levels of malonyldialdehydes (MDA) in adipose tissue of chagasic mice. Mice were harvested as in Fig. 1. MDA contents, indicative of lipid peroxidation products in BAT (a) and WAT (b) tissue of infected mice at 15, 30, and 130 dpi was determined by a TBARS assay as described in “Materials and methods”. Data are presented as n mlo/mg protein and represents mean±SD (*p<0.05; **p<0.01)
