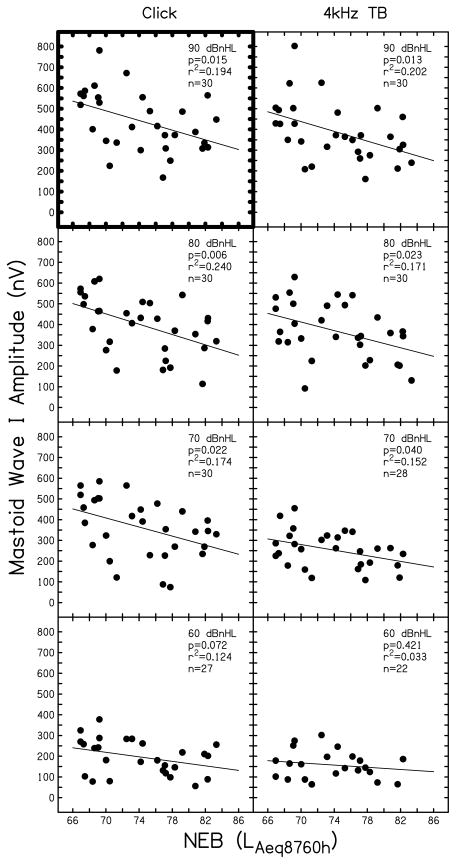
Figure 4.
Supra-threshold ABR wave I amplitude recorded with a mastoid electrode. Wave I amplitude (in nV) is shown as a function of NEB for ABRs in response to clicks (left column) and 4 kHz tone bursts (right column). Stimulus level is denoted in each panel (90 to 60 dB nHL). Symbols represent individual responses. Linear regression results are inset in each panel along with the number of subjects contributing data (n).

