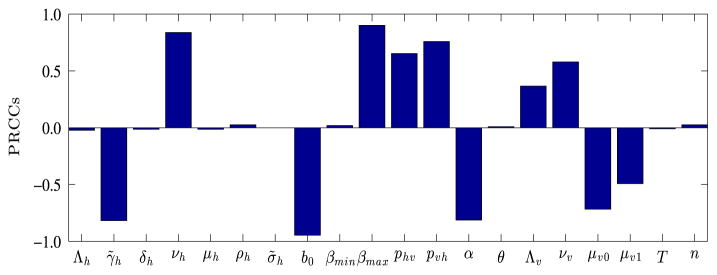
Fig. 10.

PRCCs depicting how sensitive the infectious human population, Ih is to the parameters of system (2.4) on day 365. The larger the magnitude of the PRCC, the more significant the parameter is in generating uncertainty or variability in Ih. The sign of the PRCC indicates whether an increase in a parameter will lead to more infections (+) or less infections (−). Clearly, uncertainty or variability in b, βmax, νh, γ̃h, α, and pvh influence the magnitude of the infectious class, Ih the most.
