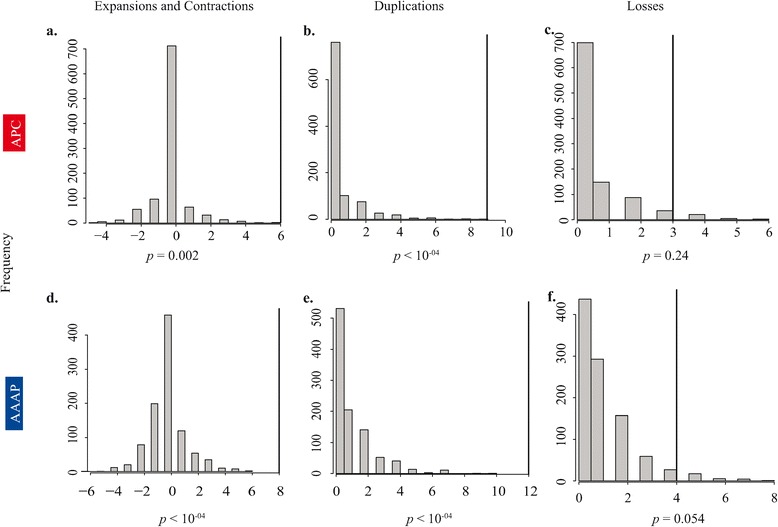
Figure 3.

Simulations of gene family evolution in Hemiptera. Null distributions of net expansion or contraction, duplications, and losses of two amino acid transporter gene families within Sternorrhyncha from 1000 simulations of a birth-death model of evolution using GenPhyloData [27]. Expansion or contraction was obtained by subtracting the number of losses from the number of duplications detected in Sternorrhyncha in a single replicate. A. Expansion or contraction in APC and D: AAAP in; B. duplications in APC and E: in AAAP; C. losses in APC and F: in AAAP. The thick black lines represent the values inferred using Notung.
