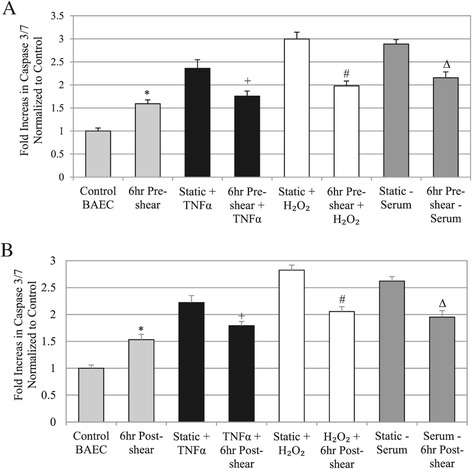
Figure 5.

Quantified cell apoptosis results based on caspase activity. A: Analysis of Caspase-3 and −7 activity in pre-sheared cells versus cells treated with stimulus alone (TNFα, H2O2, or serum depletion). B: Analysis of Caspase-3 and −7 activity in cells sheared post treatment with stimulus versus cells treated with stimulus alone (TNFα, H2O2, or serum depletion). For all caspase data: * P < 0.01 compared to Control BAEC, + P < 0.01 compared to Static + TNFα, # P < 0.01 compared to Static + H2O2, ∆ P < 0.01 compared to Static – Serum.
