
Figure 12.
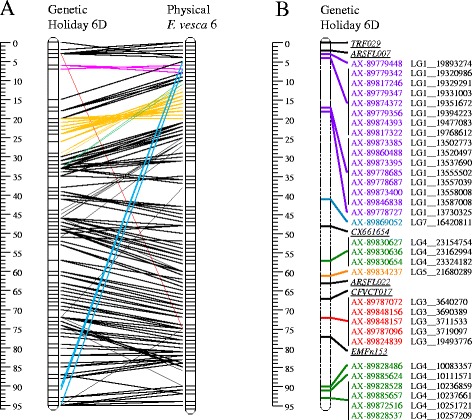
Relationship between the genetic map of LG6D of the allo-octoploid cultivar Holiday and that of the diploid cultivar F. vesca ‘Hawaii 4’. Panels A and B present SNPs and SSRs that physically came from LG6 or other LGs, respectively. The rulers indicate genetic distances in cM and physical distances in bases/ 403,743 (thus unifying scales). Different colours highlight cases of large discrepancies (Panel A), or indicate different physical LGs (Panel B). Panel A: Red & blue, proximal markers becoming distal and vice versa; Green, medium shift in position; Pink and orange, opposite order of multiple SNPs for a small and large chromosomal segment respectively.