
Figure 14.
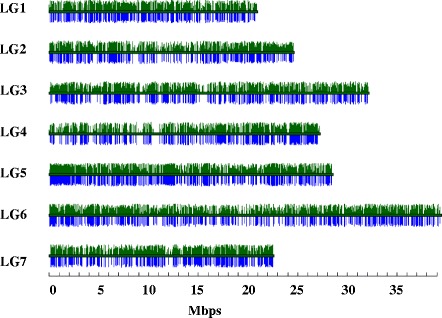
Distribution of minor allele frequency (MAF ≥ 0.1 in green, ≥ 0.35 in blue) of SNPs across seven LGs. MAF is shown according to physical location on the F. vesca ‘Hawaii 4’ v1.0 reference genome in 65 diverse strawberry accessions.
Official websites use .gov
A
.gov website belongs to an official
government organization in the United States.
Secure .gov websites use HTTPS
A lock (
) or https:// means you've safely
connected to the .gov website. Share sensitive
information only on official, secure websites.
Distribution of minor allele frequency (MAF ≥ 0.1 in green, ≥ 0.35 in blue) of SNPs across seven LGs. MAF is shown according to physical location on the F. vesca ‘Hawaii 4’ v1.0 reference genome in 65 diverse strawberry accessions.