
Figure 4.
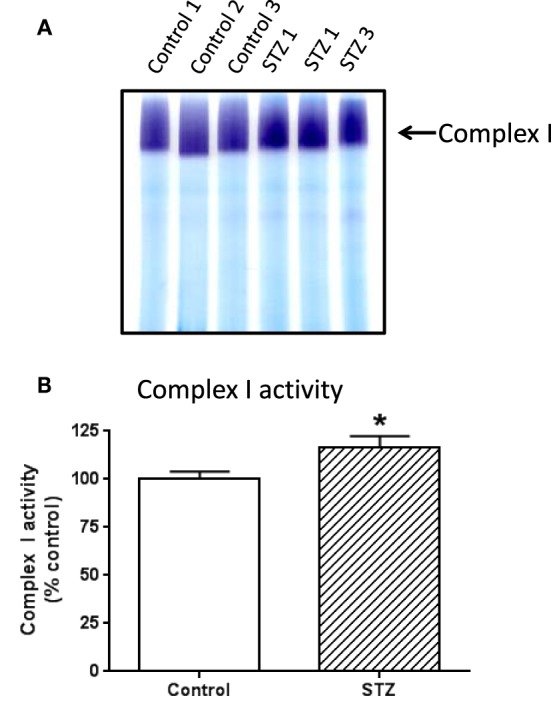
In-gel complex I activity staining and quantitation of complex I activity in each group of rats. Shown was comparison between control and diabetic (STZ) mitochondria isolated from rat kidney; (A) BN-PAGE activity staining, (B) densitometric quantification of complex I activity based on (A). P < 0.05 indicates significant difference between control and STZ groups.