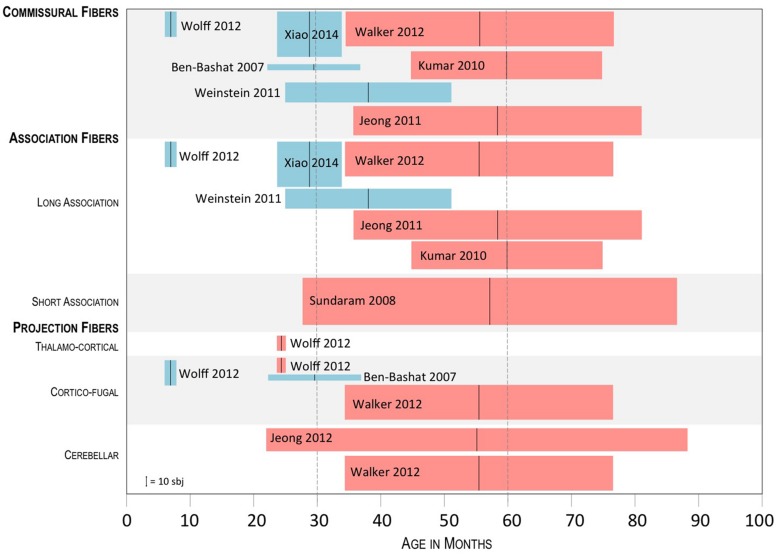
FIGURE 1.
Summary of the results of studies exploring FA in ASD subject groups whose mean age was below 60 months. Tracts showing a significant difference between ASD and controls are shown, with blue boxes indicating higher FA in ASD and red boxes indicating lower FA in ASD. The black vertical bar in the middle of the boxplots shows the mean age of the ASD group; the lateral sides of the boxplots, show the SD; height of the boxplots represents the sample size, as referred to in the lower left corner.

