
Figure 4.
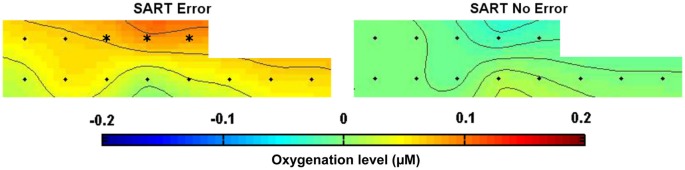
Topography of HbO2 concentration over the prefrontal cortex during SART Error (on the left) and SART No Error (on the right) conditions, averaged [−15 s; −5 s] before the apparition of the target stimulus across all subjects. The color code represents the level of HbO2 concentration changes relative to baseline (in µM). Optodes exhibiting significant differences (all in the mPFC) are marked with a * (significance level = 0.01 after correction for multiple comparisons).