Table 1.
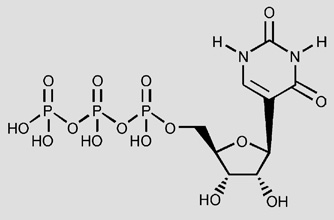
In vitro pharmacological data for UTP (1) and its analogues in the stimulation of PLC at recombinant human P2Y2 and P2Y4 receptors expressed in astrocytoma cells
 | ||||||
|---|---|---|---|---|---|---|
| Compound | Modification | Structure | EC50 at hP2Y2 receptor (µM)a |
Relative to UTP |
EC50 at hP2Y4 receptor (µM)a |
Relative to UTP |
| Native ribonucleoside-5′-triphosphates | ||||||
| 1 UTP | 0.049 ± 0.012 | 1 | 0.073 ± 0.02 | 1 | ||
| 2 ATP | 0.085 ± 0.012 | 1.7 | Antagonistb | |||
| 3a CTP | 5.63 ± 0.30 | 110 | Antagonistb | |||
| 3b GTP | 2.64 ± 0.30 | 54 | 6.59b | 90 | ||
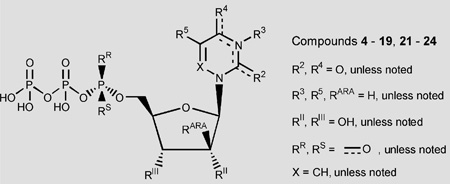
| Ribose-modified UTP analogues | ||||||
| 4 | 2′-Deoxy | RII = H | 1.08 ± 0.28 | 22 | 1.9 ± 0.5 | 26 |
| 5 | 2′-Deoxy-2′-methoxy | RII = OCH3 | 14.3 ± 7.7 | 290 | 8.2 ± 2.1 | 110 |
| 6 | 3′-Deoxy-3′-methoxy | RIII = OCH3 | NE | >1000 | NE | >1000 |
| 7 | 2′-Amino-2′-deoxy | RII = NH2 | 0.062 ± 0.008 | 1.3 | 1.2 ± 0.3 | 16 |
| 8 | 2′-Azido-2′-deoxy | RII = N3 | 5.0 ± 2.1 | 100 | 1.1 ± 0.1 | 15 |
| 9 | 2′-Deoxy-2′-fluoro | RII = F | 0.78 ± 0.11 | 16 | 0.54 ± 0.14 | 7.4 |
| 10 | Arabino | RII = H, RARA = OH | 0.087 ± 0.010 | 1.8 | 0.71 ± 0.08 | 9.7 |
| 11 | 2′-Deoxy-arabino-2′-fluoro- | RII = H, RARA = F | 0.52 ± 0.15 | 11 | 0.52 ± 0.08 | 7.1 |
| Uracil-modified UTP analogues | ||||||
| 12 | 5-Bromo | R5 = Br | 0.75 ± 0.1 | 15 | 2.1 ± 0.7 | 29 |
| 13 | 5-Iodo | R5 = I | 0.83 ± 0.1 | 17 | 4.0 ± 1.7 | 55 |
| 14 | 5-Methyl | R5 = CH3 | 0.48 ± 0.1 | 9.8 | 3.9 ± 1.6 | 53 |
| 15 | 2-Thio | R2 = S | 0.035 ± 0.004 | 0.71 | 0.35 ± 0.01 | 4.8 |
| 16 | 4-Thio | R4 = S | 0.026 ± 0.01 | 0.53 | 0.023 ± 0.005 | 0.32 |
| 17 | 6-Aza | X = N | 8.6 ± 3.7 | 180 | NE | >1000 |
| 18 | 3-Methyl | R3 = CH3 | 1.20 ± 0.20 | 24 | 3.4 ± 0.8 | 47 |
| 19 | Zebularine analogue | R4 = H, H | 8.9 ± 0.5 | 180 | NE | >1000 |
| 20 | Pseudouridine | c | 0.78 ± 0.5 | 16 | 3.0 ± 0.3 | 41 |
| Phosphate-modified UTP analogues | ||||||
| 21 | Rp-α-thio | RR = S | 5.4 ± 1.5 | 110 | 27 ± 5 | 370 |
| 22 | Sp-α-thio | RS = S | 14 ± 5.5 | 290 | 81 ± 8 | 1100 |
| 23 | 2′-Deoxy-Rp-α-thio-triphosphate | RR = S, RII = H | 12.5 ± 6.7 | 260 | NE | >1000 |
| 24 | 2′-Deoxy-Sp-α-thio triphosphate | RS = S RII = H | NE | >1000 | NE | >1000 |
NE: no effect at 10 µM.
Agonist potencies were calculated using a four-parameter logistic equation and the GraphPad software package (GraphPad, San Diego, CA). EC50 values (mean ± S.E.) represent the concentration at which 50% of the maximal effect is achieved. EC50 is also expressed relative to the value for UTP at each receptor. Relative efficacies (%) were determined by comparison with the effect produced by a maximal effective concentration of reference agonist (UTP) in the same experiment. For all of the nucleotides, except 22 and 23, for which an EC50 is reported in this table, ~100% efficacy was achieved.
ATP antagonized the human P2Y4 receptor with a KB of 0.708 µM. CTP (100 µM) inhibited the response to an EC50 concentration of UTP by ~40% [11].
Compound 20 has the following structure: