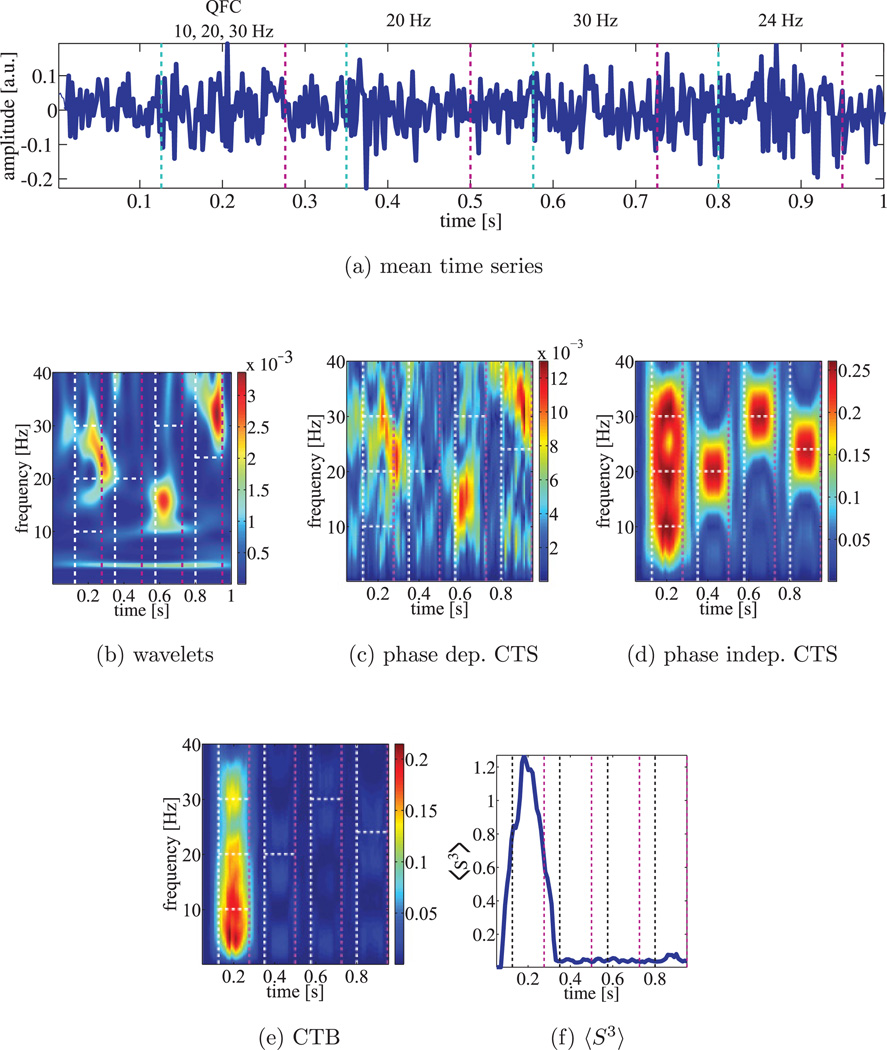
Figure 6.
Cross-trial spectrogram (CTS) of nonphase-coherent simulated data with white noise. Four segments of noisy short signals of 10, 20, 24, and 30 Hz with no phase coherence added to the data. (a) The mean over the 20 trials. (b) The wavelet spectrogram. (c) The phase-dependent CTS. (d) The phase-independent CTS. (e) The bispectrogram CTB. (f) The bispectral detector .

