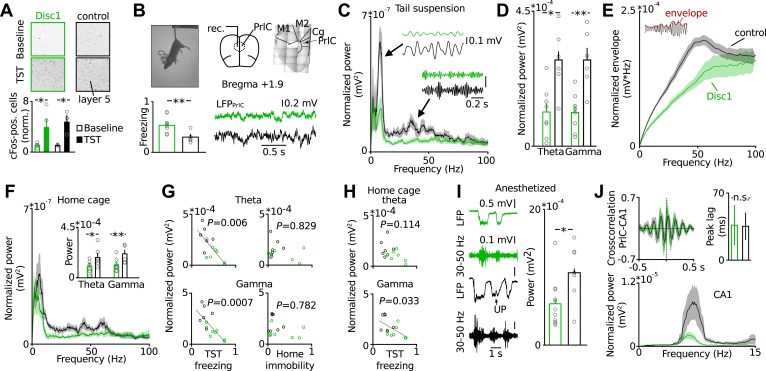
Figure 2. Behavioural despair of Disc1 mice correlates with impairment in theta and low-gamma oscillations in the PrlC.
(A) TST activates cFos in PrlC independent from genotype (fold increase Disc1: 3.92 ± 1.54, n = 4; control: 4.78 ± 1.07, n = 3). (B) LFP recording during TST. Enhanced freezing of Disc1 mice is preserved in the electrode-implanted cohort (52.2 ± 5.8 vs 29.4 ± 4.0, n = 8, 6). M1,2: motor cortex, Cg: cingulate cortex. (C and D) Reduced power of Disc1 mice in the theta (0.11 ± 0.03 vs 0.29 ± 0.04 mV2*10−3) and low-gamma band (0.11 ± 0.02 vs 0.29 ± 0.04 mV2*10−3, n = 8, 6). Insets: filtered traces. (E) Oscillation amplitudes over frequency. (F) Oscillatory defects are observed in the home cage (theta: 0.10 ± 0.02 vs 0.18 ± 0.04 mV2*10−3, gamma: 0.12 ± 0.02 vs 0.22 ± 0.03 mV2*10−3, n = 8, 6). (G) Theta and low-gamma power correlate with TST freezing duration (theta: r = −0.6923, p = 0.0061; low-gamma: r = −0.79, p = 0.0008) but not with home cage immobility (r = −0.029, r = −0.222). Black lines: linear fits. (H) Home cage low-gamma but not theta can predict TST freezing (gamma: r = −0.569, theta: r = −0.440). (I) Low-gamma activity in Disc1 PrlC is impaired during UP-states in anesthesia (0.6 ± 0.1 vs 1.1 ± 0.2 mV2*10−3, n = 11, 7). (J) Top, cross-correlation of LFP simultaneously recorded in hippocampus and PrlC suggests that theta oscillations are driven by hippocampus (peak lag: 36.5 ± 20.9 vs 35.3 ± 14.3 ms, n = 5, 4). Bottom, hippocampal theta power is impaired in Disc1 mice (0.87 ± 0.23 vs 4.14 ± 1.54 mV2*10−3, n = 4, 3, p = 0.01). *p < 0.05, **p < 0.01. Data are mean ± SEM, circles are individual mice.


