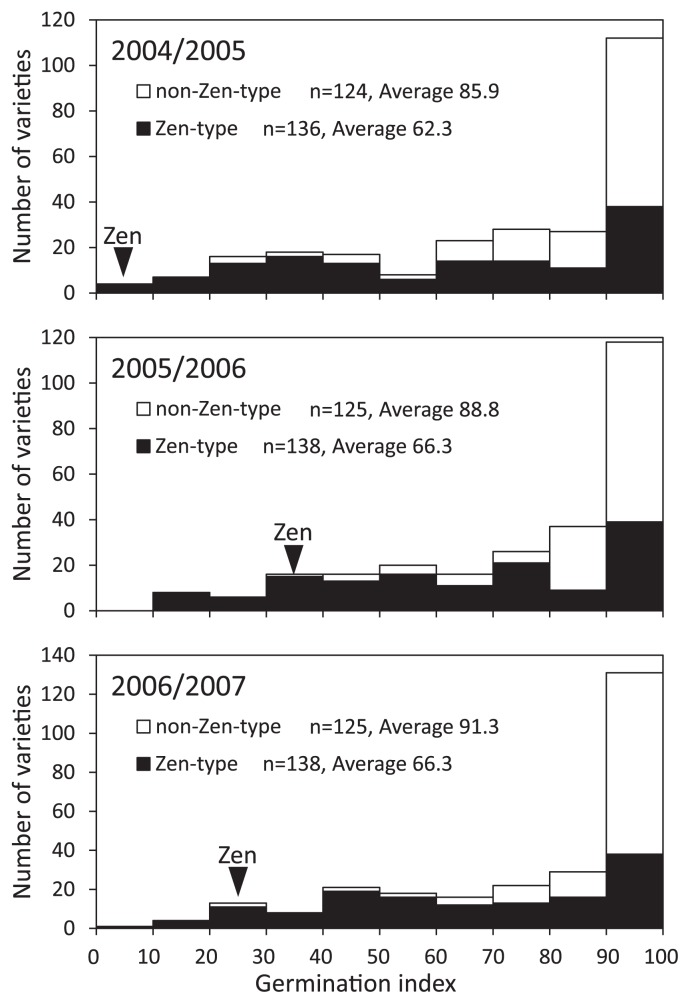
Fig. 2.
Frequency distribution of Japanese wheat varieties for GI grown in 2004/2005, 2005/2006, and 2006/2007 growing seasons. Sample size (n) and the average GI values for the varieties carrying the Zen-type SNP (solid columns) and non-Zen-type SNP (open columns) are shown. A black arrowhead indicates the GI value for ‘Zenkoujikomugi’.

