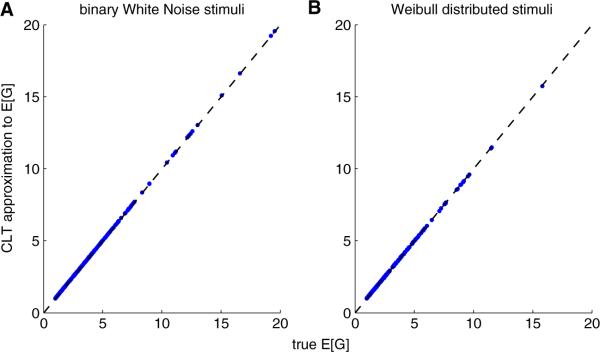
Fig. 1.

The normal approximation for ζθ is often quite accurate for the computation of E [G] (Eq. (13) in the text). Vertical axis corresponds to central limit theorem approximation of E [G], and horizontal axis corresponds to the true E [G], computed numerically via brute-force Monte Carlo. We used a standard Poisson regression model here, corresponding to an exponential G function. The stimulus vector x is composed of 600 i.i.d. binary (a) or Weibull (b) variables; x has mean 0.36 in panel A, and the Weibull distribution in panel B has scale and shape parameters 0.15 and 0.5, respectively. Each dot corresponds to a different value of the stimulus filter θ. These were zero-mean, Gaussian functions with randomly-chosen norm (uniformly distributed on the interval 0 to 0.5) and scale (found by taking the absolute value of a normally distributed variable with variance equal to 2)
