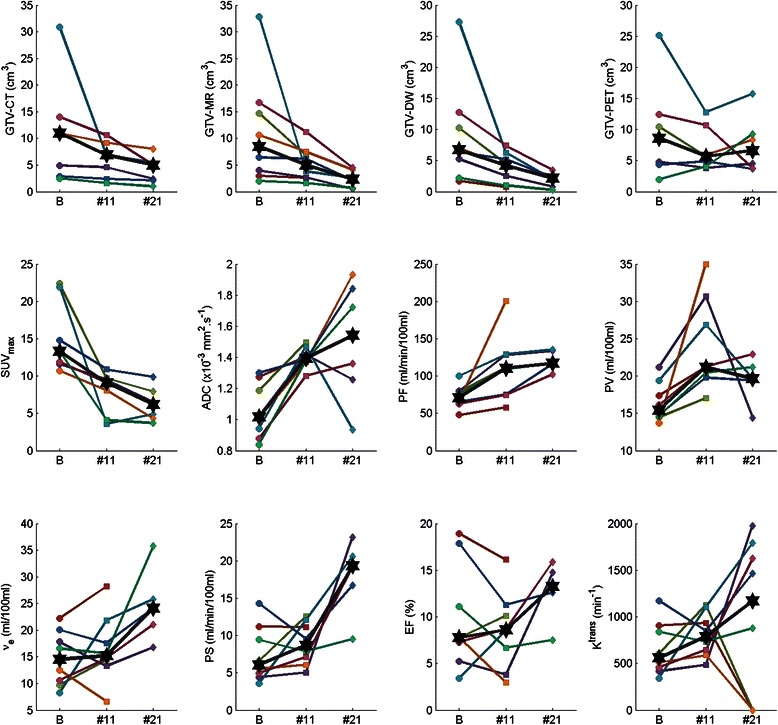
Figure 2.

Absolute changes in anatomical and functional imaging parameters during radiotherapy. Plots of GTV-CT, GTV-MRI, GTV-DW, GTV-PET, SUVmax, mean ADC value (ADC), Plasma Flow (PF), Plasma Volume (PV), Interstitial Volume (νe), Permeability Surface Area Product (PS), Extraction Fraction (EF) and Ktrans at baseline (B), fraction 11 (#11) and fraction 21 (#21) timepoints. ✶= median data point at each imaging timepoint. Coloured lines represent individual patients.
