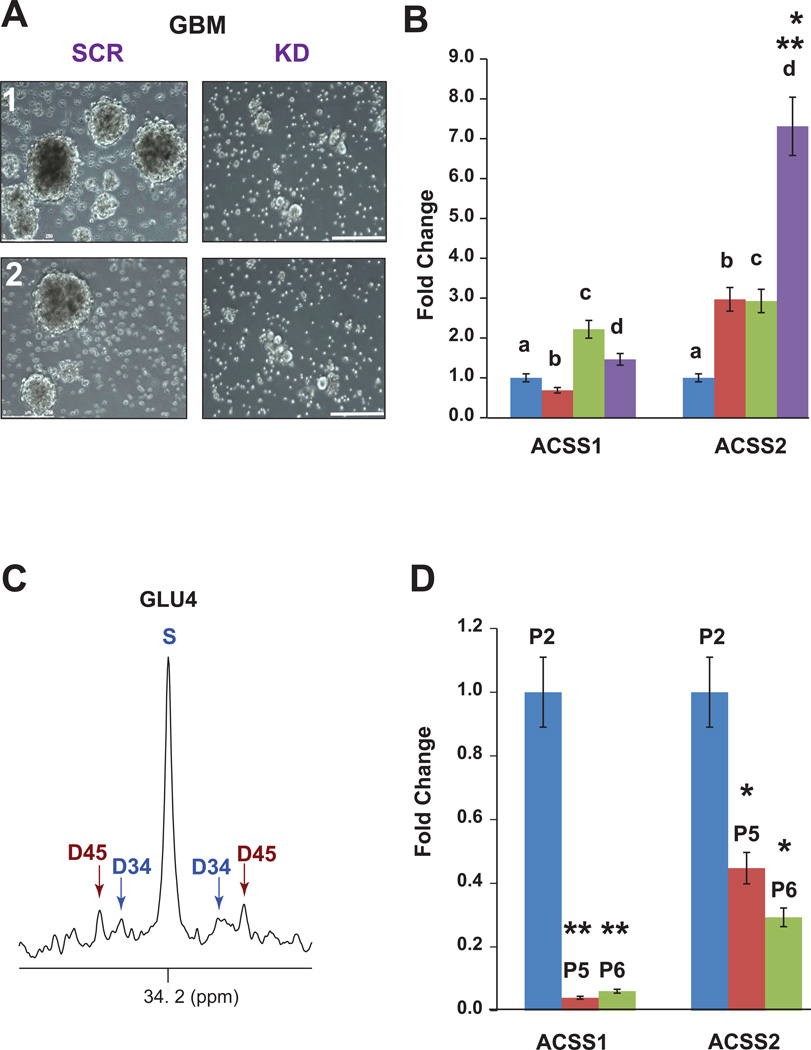
Figure 5. Expression of ACSS2 is linked to GBM growth and malignant potential.
(A) Comparison of primary GBM cultures infected with retroviruses expressing ACSS2 shRNAi (KD) or scrambled shRNAi (SCR). Two independent cultures are shown. Neurospheres are visible in the SCR cultures but not in KD cultures. Scale bars 250 µm.
(B) Fold change (qRT-PCR) of ACSS1 and ACSS2 mRNA in primary conditional (floxed) astrocyte cultures after infection with adenocre to produce (a) p53−/−, (b) p53−/−, PTEN−/−, (c) p53+/−, PTEN−/−, BRAFV600E and (d) p53−/−, PTEN−/−, BRAFV600E. *p<0.01 vs b or c; **p<0.001 vs a. C. Glutamate C4 multiplets from 13C-NMR spectrum of an intracranial tumor arising from p53−/−, PTEN−/−, BRAFV600E astrocytes after co-infusion of 13C-acetate and 13C-glucose. D. Fold change (qRT-PCR) of ACSS1 and ACSS2 mRNA in primary astrocytes in culture at passages 2 (P2), 5 (P5), and 6 (P6). *p<0.01, ** p<0.005 vs P2. See also Figure S3B.

