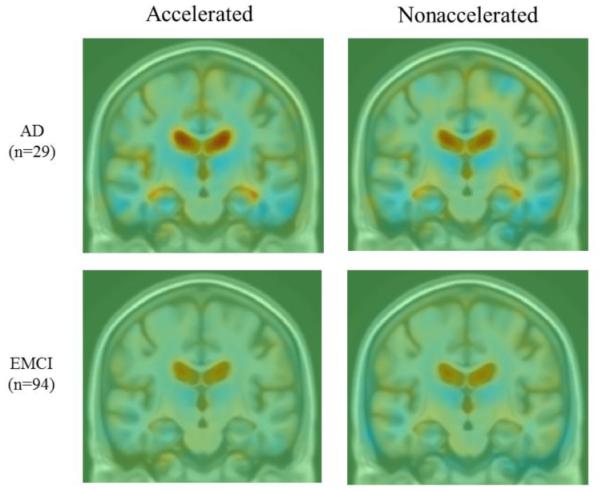
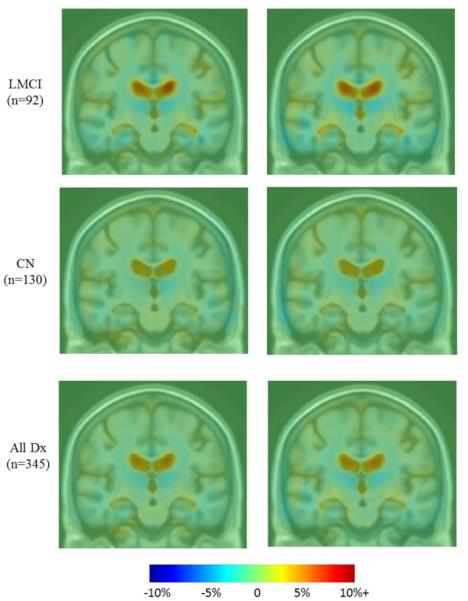
Figure 1.


Average maps of cumulative brain atrophy over 6 months derived from all diagnostic groups separately (AD, EMCI, LMCI, CN) and together (all Dx) with both accelerated and nonaccelerated follow-up scans. Average patterns of brain atrophy computed from accelerated and nonaccelerated scans are highly similar. Color bar represents % tissue change at 6 months relative to baseline. Red indicates expansion (ventricles) and blue indicates contraction (temporal lobes).
