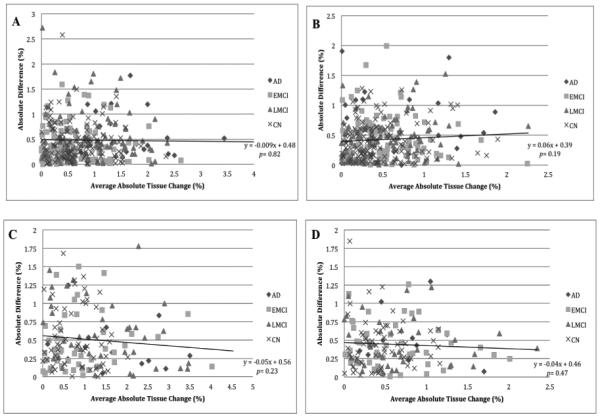
Figure 2.

Plots of average absolute tissue change (%) vs. absolute difference (%) for accelerated and nonaccelerated numerical summaries. Each point represents a single subject where the average of the accelerated and nonaccelerated numerical summary (absolute tissue change %) is plotted along the x-axis, and the absolute difference between accelerated and nonaccelerated numerical summary (%) is plotted along the y-axis. The data are organized by diagnosis including linear trend lines with p-values for the entire sample. A: 6-month stat-ROI; B: 6-month temporal-ROI; C: 12-month stat-ROI; D: 12-month temporal-ROI.
