
Figure 3.
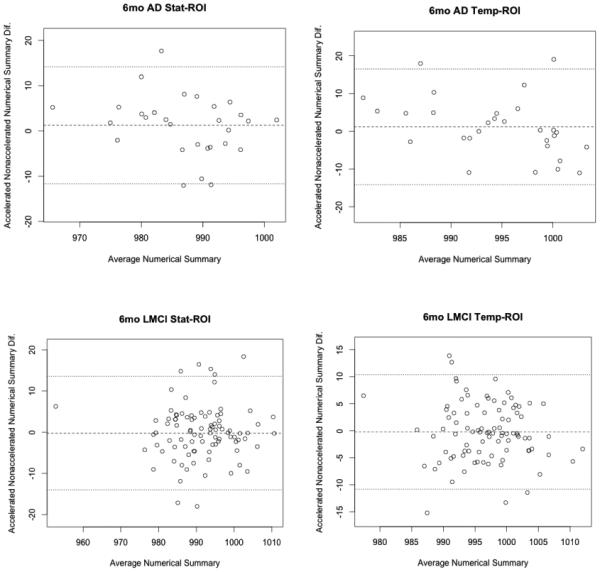
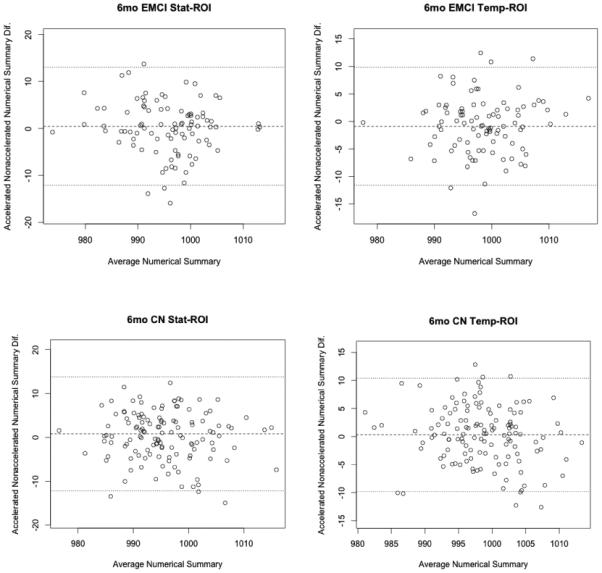
6-month Bland-Altman plots for both statistical and tempora -ROI numerical summary measures for each of the four diagnostic groups (AD, EMCI, LMCI, CN). Each point represents the mean of raw accelerated and nonaccelerated TBM-derived numerical summary value (x-axis) plotted against difference between those values. Mean of the accelerated-nonaccelerated numerical summary difference and ±1.96 standard deviation lines are provided. The scale is based on TBM-derived Jacobian values. These use arbitrary units where 1000 denotes no change and 990 denotes 1% loss of volume over the scan interval.