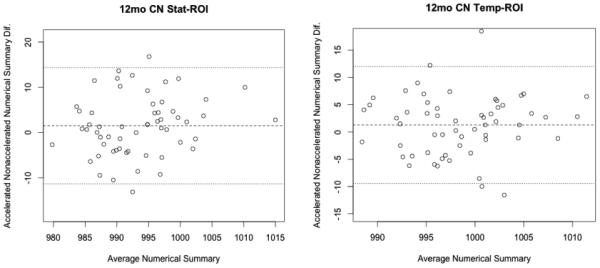
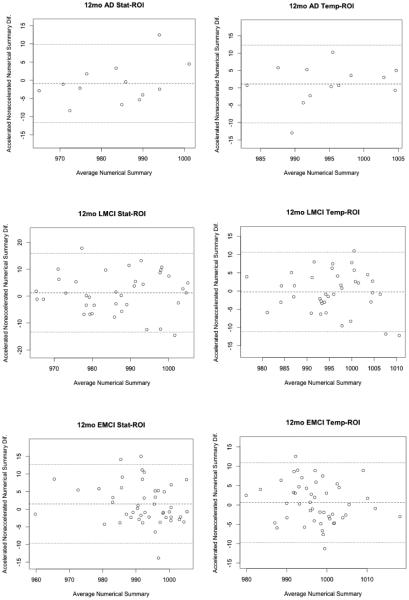
Figure 4.

12-month Bland-Altman plots for both statistical and temporal ROI numerical summary measures for each of the four diagnostic groups (AD, EMCI, LMCI, CN). Each point represents the mean of raw accelerated and nonaccelerated TBM-derived numerical summary value (x-axis) plotted against difference between those values. Mean of the accelerated-nonaccelerated numerical summary difference and ±1.96 standard deviation lines are provided. The scale is based on TBM derived Jacobian values, which provide arbitrary units where 1000 denotes no change and 990 denotes 1% loss of volume over the scan interval.

