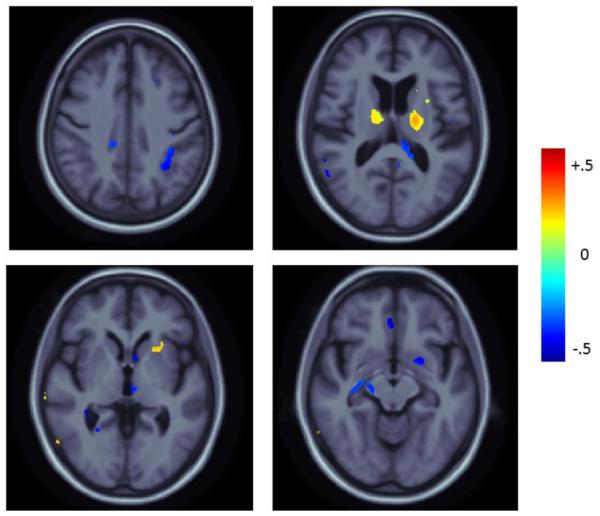
Figure 5.

Mean difference maps displaying the percent difference in the mean atrophy rate of accelerated minus nonaccelerated scans for significant voxels (after FDR correction at 5%) in the full-group comparison over 6-month period relative to baseline. Positive values (blue) represent areas where the mean atrophy rate was higher in nonaccelerated scans. Negative values (red) represent areas where the mean atrophy rate was higher in accelerated scans.
