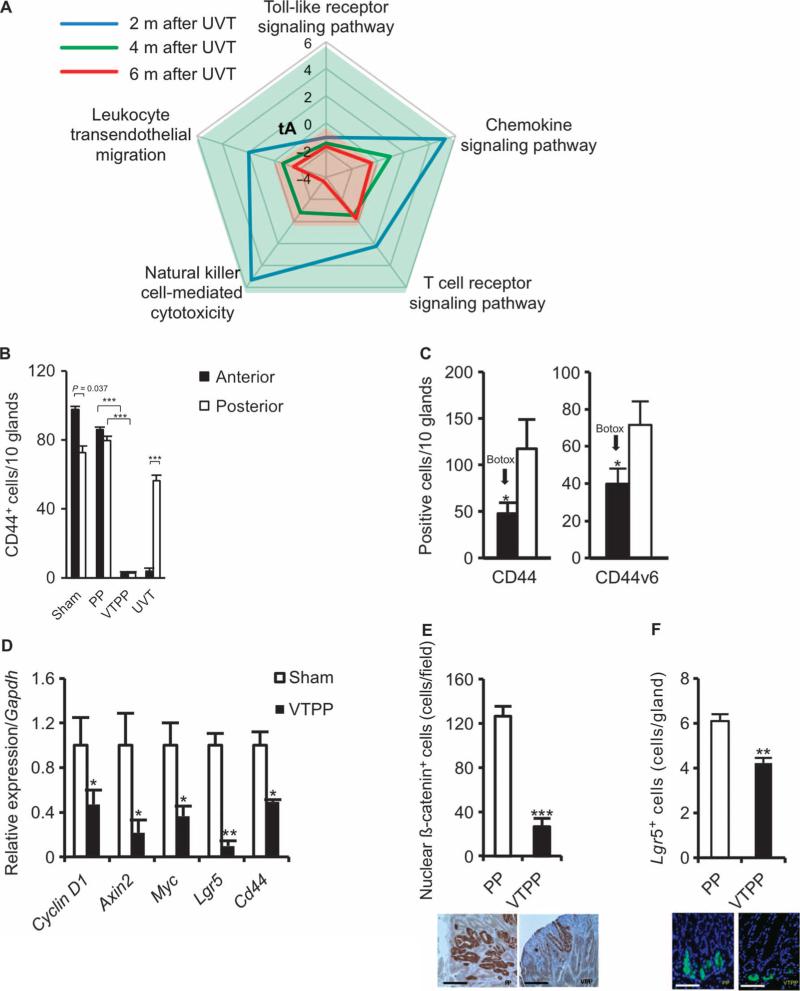
Fig. 4. Denervation alters inflammation-related signaling and suppresses stem cell expansion in mouse models of gastric cancer.
(A) Time course of five signaling pathways determined by microarray analysis in the anterior side of the stomach at 2 (blue), 4 (green), and 6 (red) months after anterior UVT compared with the posterior side of the stomach in INSGAS mice. Total net accumulated perturbation (expressed as tA score): −4 to 6. tA score > 0: activation; tA score < 0: inhibition. (B) Numbers of CD44+ cells in the anterior and the posterior sides of the stomach of INS-GAS mice at 6 months after surgery. Means ± SEM. P = 0.037 (n = 27, paired t test) between the anterior and the posterior sides in sham operation (Sham), P = 1.00 × 10⁻⁶ or P = 6.00 × 10⁻⁶ (n = 25, Dunnett's test) between PP and VTPP (anterior and posterior sides, respectively), and P = 1.74 × 10⁻³ (n = 30, paired t test) between the anterior and the posterior sides within anterior UVT. (C) Numbers of CD44-immunoreactive cells (CD44) and CD44v6-immunoreactive cells (CD44v6) in the anterior and the posterior sides of the stomach of INSGAS mice at 6 months after Botox injection. Means ± SEM. P = 0.034 and P = 0.021, respectively (n = 16, paired t test) between the anterior and the posterior sides of the stomach. (D) Relative gene expression of Cyclin D1, Axin2, Myc, Lgr5, and Cd44 in the gastric tumors of sham-operated or VTPP-treated mice 36 weeks after MNU treatment (n = 4 per group). Means ± SEM. P = 0.04 (Cyclin D1), 0.04 (Axin2), 0.03 (Myc), 0.001 (Lgr5), and 0.01 (Cd44) (Student's t test). (E) Number of cells showing nuclear β-catenin accumulation in the gastric tumors of PP- or VTPP-treated mice 36 weeks after MNU treatment (n = 4 per group). Means ± SEM. P = 7.00 × 10⁻⁶ (Student's t test). Representative immunohistochemical microphotographs are shown below. Scale bars, 40 μm. (F) Number of Lgr5+ cells in the stomachs of PP- or VTPP-treated mice 6 weeks after MNU treatment (n = 5 per group). Means ± SEM. P = 4.00 × 10⁻⁶ (Student's t test). Representative Lgr5-GFP+ microphotographs are shown below. Scale bars, 20 μm.

