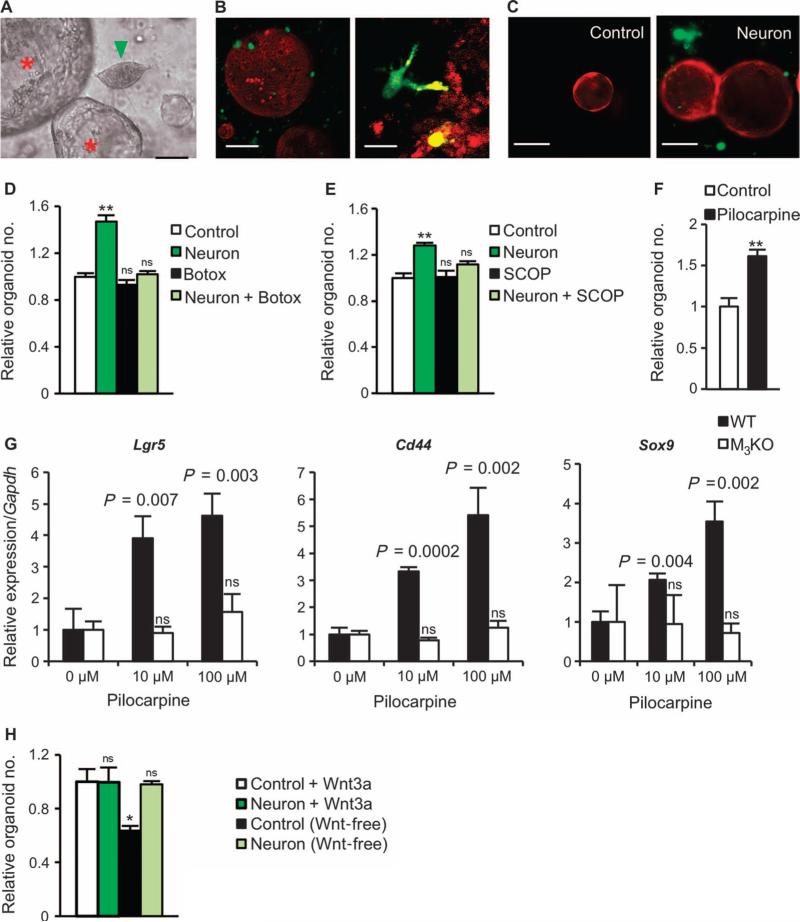
Fig. 6. Neurons activate Wnt signaling in gastric stem cells through the M3 receptor.
(A to C) Representative microphotographs showing gastric organoids along with neurite outgrowth. (A) Guinea pig enteric neuron (green arrowhead) with gastric organoids (red asterisks). Scale bar, 5 μm. (B) Three-dimensional images (low and high magnifications) obtained by two-photon microscopy of gastric organoids (red) derived from an ACTB-tdTomato mouse and neurons (green) derived from a UBC-GFP mouse. Scale bars, 20 μm (left) and 5 μm (right). In (C), fluorescent images show gastric organoids (red) alone (left, Control) or cocultured with neurons (green) (right, Neuron) at day 4. Scale bars, 10 μm. (D) Relative number of organoids after 72 hours in control, neuron coculture, control plus Botox, or neuron coculture plus Botox. Means ± SEM. n = 4 per group. **P = 0.002 (Student's t test). ns, not significant compared to control. (E) Relative number of organoids after 72 hours in control or neuron coculture with or without scopolamine (SCOP) (1 μg/ml). Means ± SEM. n = 4 per group. **P = 0.003 (Student's t test). ns, not significant compared to control. (F) Relative number of organoids at day 10 with or without 100 μM pilocarpine. Means ± SEM. n = 4 per group. **P = 0.006 (Student's t test) between control and pilocarpine. (G) Relative mRNA expression for Lgr5, Cd44, and Sox9 in relation to Gapdh on day 7 with or without 10 or 100 μM pilocarpine in gastric organoids isolated from WT or M3KO mice. Means ± SEM. Student's t test between 0 μM and 10 or 100 μM pilocarpine. n = 4 per group. (H) Relative number of organoids at day 10 with or without neurons and/or Wnt3a. Means ± SEM. n = 4 per group. ns, not significant. *P = 0.030 compared to Control + Wnt3a (Student's t test).

