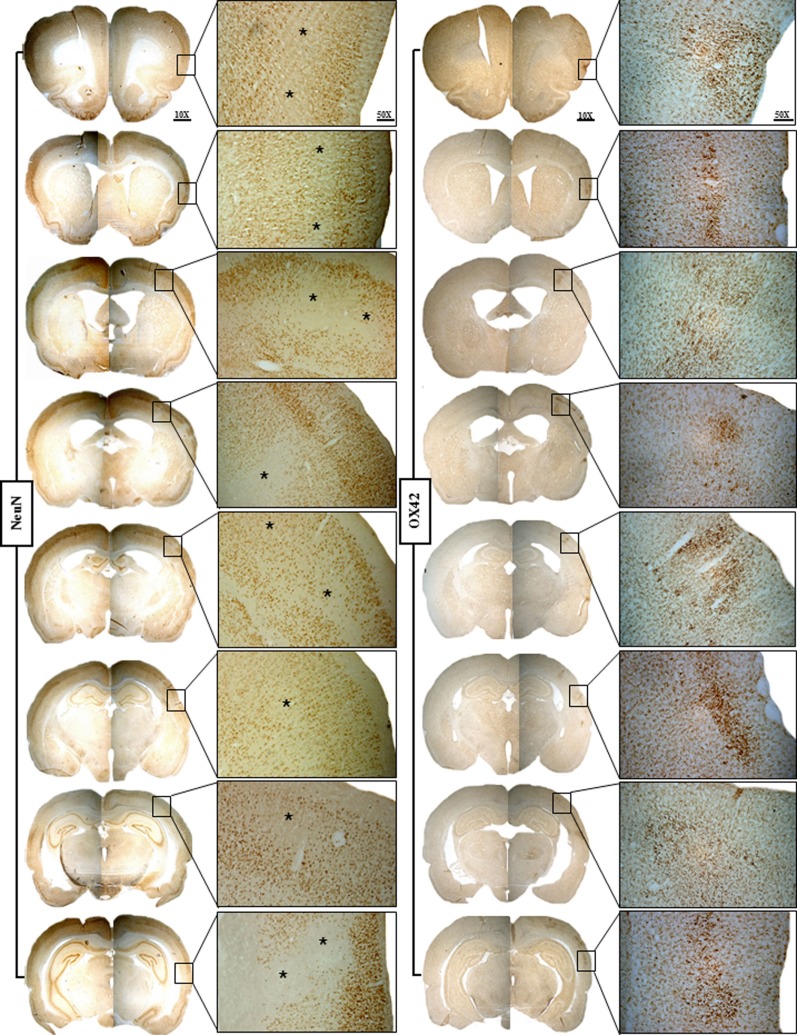
Figure 4.
Representative brain sections of Rat 1 of the 15 min MCAo group showing NeuN staining on the left and OX42 staining on the right for the eight selected coronal sections. The findings are illustrated at ×25 magnification of the boxes shown at ×10 magnification. This figure highlights the striking topographical congruence of NeuN and OX42 changes in the affected cortical areas. Karyolysis, karyorrhexis, nuclear pyknosis, and patches of selective neuronal loss (SNL; *) are evident on NeuN, while increased population of highly activated microglia matching the areas of SNL is evident on OX42, an association typical for recent SNL.

