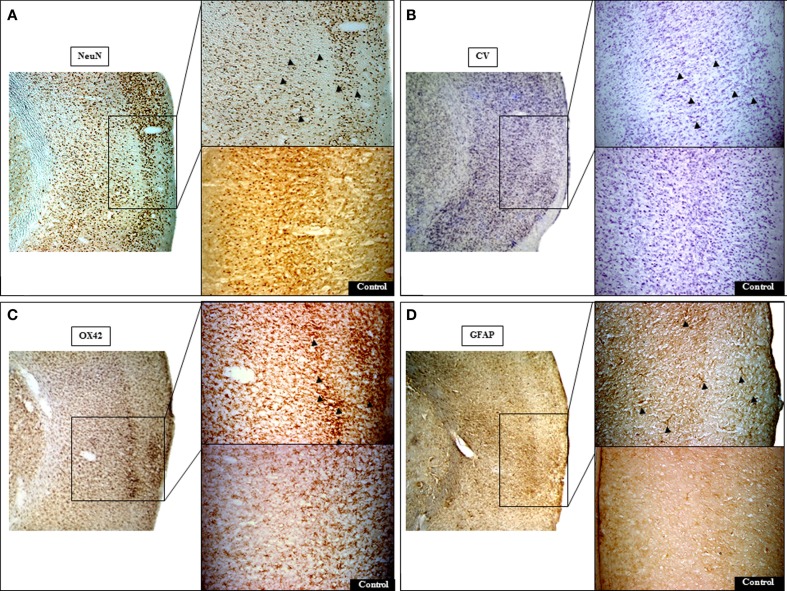
Figure 5.
Representative histological micrographs demonstrating pure selective neuronal loss (SNL) in 15 min MCAo rat # 1 (bregma +1 mm). Areas of SNL are clearly documented on NeuN (A) and less clearly so on Cresyl violet (CV) staining (B). At higher resolution, NeuN staining revealed neuronal alterations ranging from clumping and condensation of nuclear chromatin (fragmented appearance) to pyknotic nuclei (arrowheads) that are less conspicuous on CV. Note prominent activated microglia [arrowheads; (C)] and astrocytosis [arrowheads; (D)] on OX42 and GFAP stains, respectively, topographically congruent with areas of SNL on NeuN. The contralateral cortical region (control side) exhibits normal appearances. The left image of each section represents identical sections with different staining at low magnification (25×). For each stain, the top right image shows the area of interest at higher magnification (50×).

