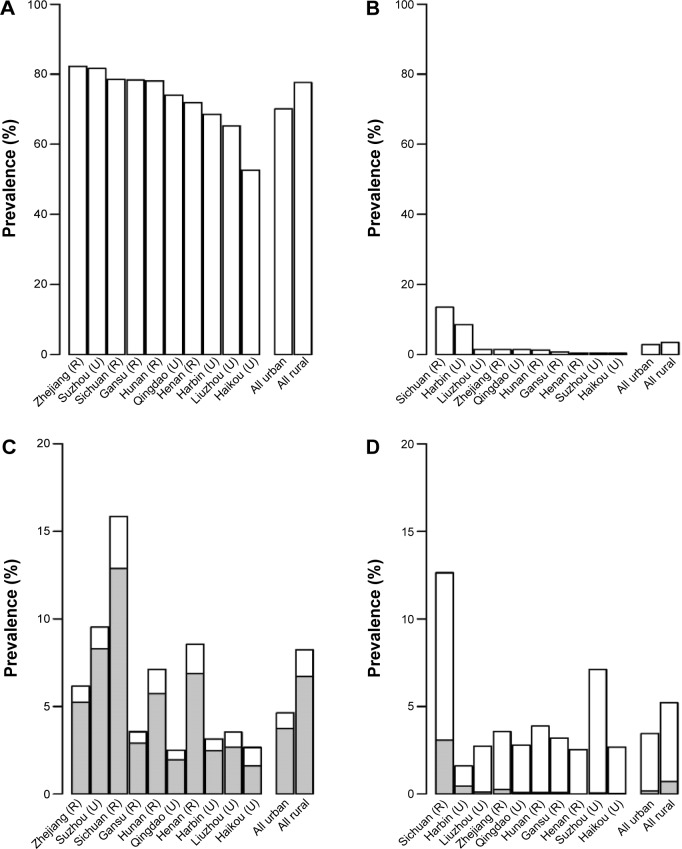
Figure 2.
Prevalence of smoking and airflow obstruction in regular smokers in the ten areas.
Notes: (A and B) Prevalence of regular smoking in men and women, respectively. (C and D) Prevalence of airflow obstruction in men and women, respectively. The percentage of each shaded bar represents the percent of airflow obstruction cases in that region for smokers. Bars for all plots are order by the regional prevalence of regular smoking in men or women.
Abbreviations: R, rural; U, urban.

