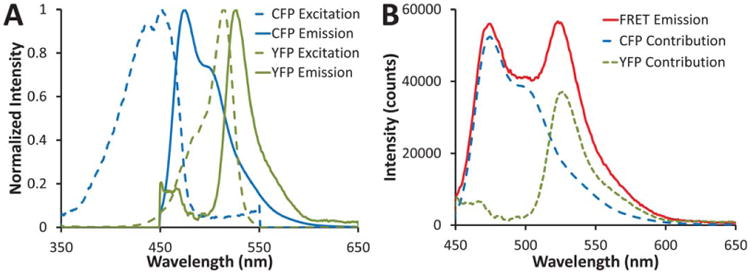
Figure 1.

A: Excitation (dashed lines) and emission (solid lines) spectra of CFP (blue) and YFP (green), normalized to the peak intensity value. B: A typical FRET emission spectrum (red solid line) with the estimated CFP (blue long-dash line) and YFP (green short-dash line) contributions indicated. [Color figure can be viewed in the online issue, which is available at wileyonlinelibrary.com]
