Figure 2.

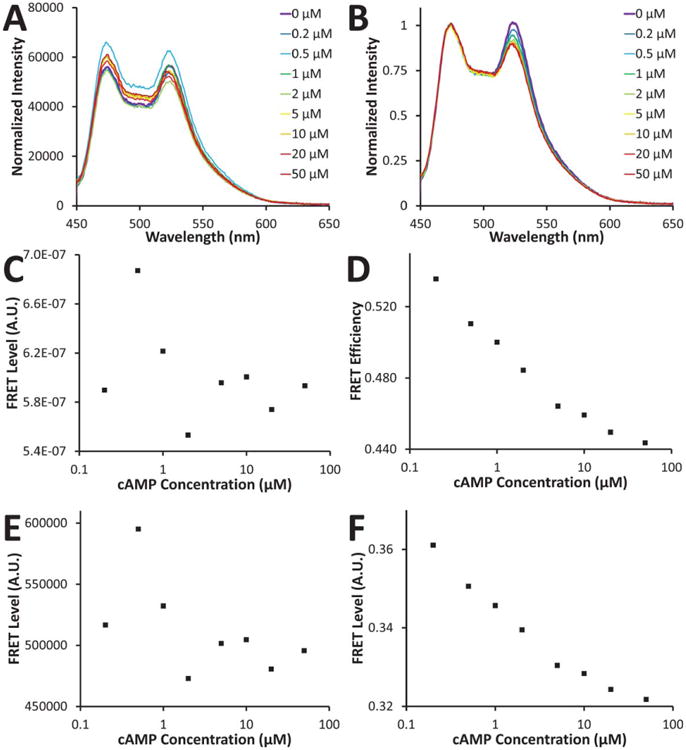
A: cAMP dose-dependence of FRET emission; B: the same data normalized to the CFP emission peak (473 nm); C: FRET response calculated using a one filter set method; D: FRET response calculated using a two filter set method; E: FRET response calculated using a three filter set method; F: FRET response calculated using a three filter set method and corrected for changes in CFP concentration. Note that panels C and E represent FRET indices, whereas panels D and F represent FRET efficiencies. Normalized FRET responses are shown in Figure 4. [Color figure can be viewed in the online issue, which is available at wileyonlinelibrary.com]
