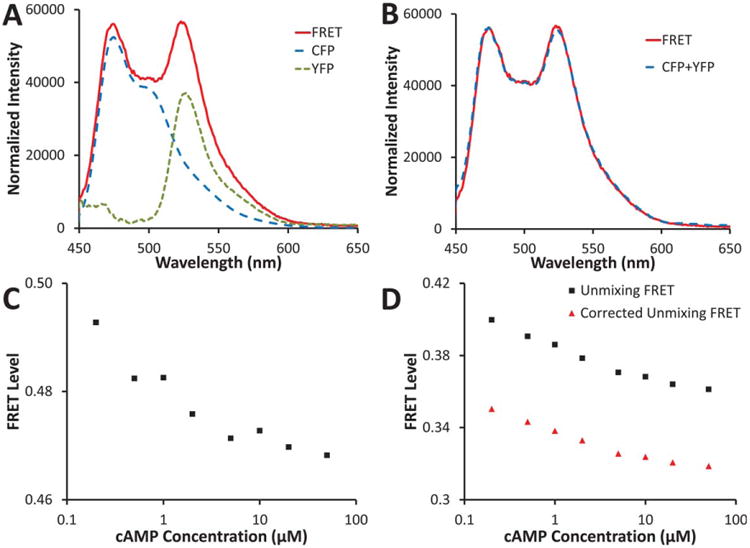
Figure 3.

A: FRET spectrum (red solid line) for basal (0 μM) cAMP from Figure 2 showing estimated contributions of CFP (long-dash blue line) and YFP (short-dash green line) calculated using linear unmixing; B: the sum of the estimated CFP and YFP contributions (dashed blue line) very closely matches the FRET spectrum from A (solid red line); C: FRET efficiency calculated using the CFP peak intensity (473 nm) and the YFP peak intensity (525 nm); D: FRET efficiency calculated by linear unmixing, as shown in A, and dividing the CFP abundance by the CFP+YFP abundance (black squares); the linear unmixing FRET has been further corrected by estimating the percent of the acceptor signal that is due to direct excitation and then subtracting this percent from the total acceptor signal before dividing by the donor signal (red triangles), as shown in Eq. (13). Normalized FRET responses are shown in Figure 4. [Color figure can be viewed in the online issue which is available at wileyonlinelibrary.com]
