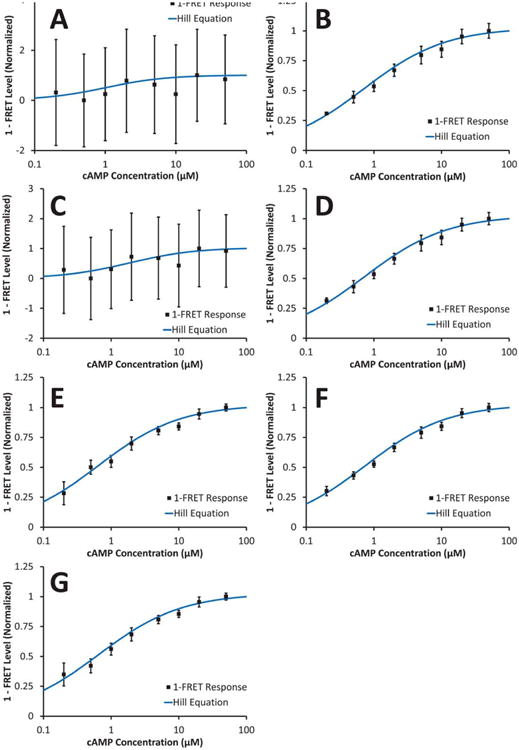
Figure 4.

1-FRET response normalized to minimum and maximum FRET levels. Error bars indicate the standard error-of-the-mean (n = 3) for each cAMP concentration. A: one-filter set method; B: two-filter set method; C: three-filter set method; D: three-filter set method and corrected for changes in CFP concentration; E: YFP-CFP peak intensity ratio; F: linear unmixing YFP-CFP ratio; G: linear unmixing YFP-CFP ratio, corrected for direct excitation of YFP. Note that panels A and C represent FRET indices, whereas panels B, D, E, F, and G represent FRET efficiencies. [Color figure can be viewed in the online issue, which is available at wileyonlinelibrary.com]
