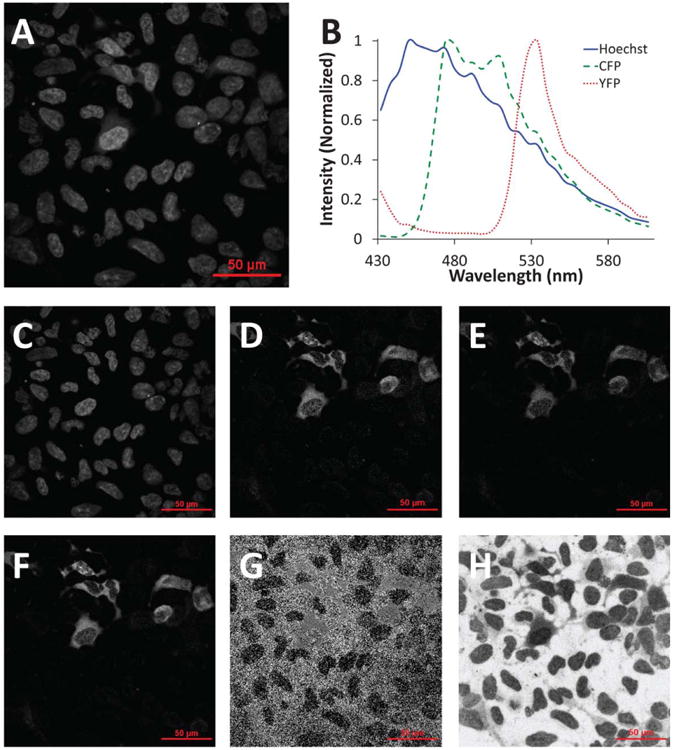
Figure 5.

Hyperspectral confocal microscope images were unmixed to calculate fluorophore intensities and the FRET efficiency. A: Raw hyperspectral confocal microscope image (all wavelength bands summed) of HEK-293 cells expressing the CFP-Epac-YFP probe; B: the spectral library used for linear unmixing; nonnegatively constrained linear unmixing was used to calculate images for C: Hoechst, D: CFP, and E: YFP; F: the unmixed CFP and YFP images were summed to locate expressing (transfected) cells; G: the FRET efficiency was calculated using equation 23 (note that this image was later masked so that only regions with sufficient signal were used for single-cell FRET calculations, as shown in Figure 6); H: the root-mean-square (RMS) percent error associated with linear unmixing was calculated as the RMS residual from unmixing divided by the RMS signal of the original spectral image. [Color figure can be viewed in the online issue which is available at wileyonlinelibrary.com]
