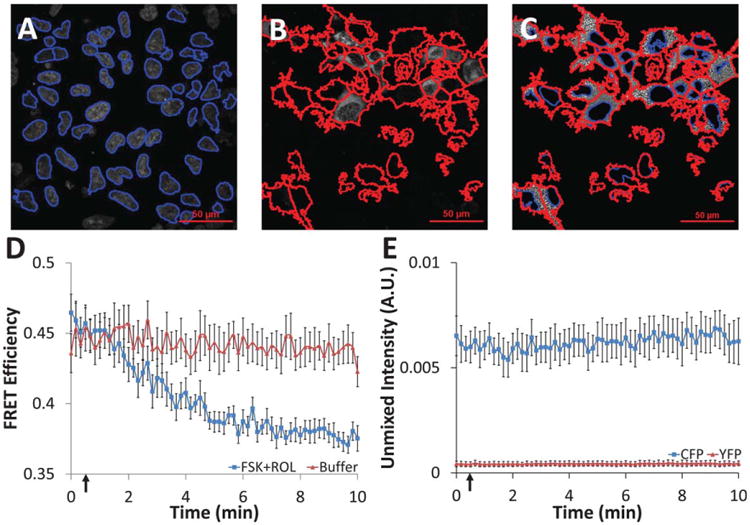
Figure 6.

Single-cell time course data were extracted from unmixed hyperspectral confocal images using feature identification and quantification in Cell Profiler software. A: All nuclei were first identified from the unmixed Hoechst image (nuclei outlines shown in blue); B: nuclei within expressing cells were expanded to identify expressing cell borders (cell outlines shown in red); C: the area between nuclei and cell borders was labeled as expressing cell cytoplasm (nuclei shown in blue, cell borders in red, grayscale values represent FRET efficiency); mean intensity values were measured on a per-cell basis for cytoplasm regions with a solidity ≥0.4; D: administration of 10 μM forskolin (adenylyl cyclase activator) and 10 μM rolipram (phosphodiesterase inhibitor) at 30 seconds (indicated by arrow) resulted in the expected increase in cytosolic cAMP and a subsequent decrease in cytosolic FRET efficiency for cells expressing the CFP-Epac-YFP probe, while cells treated with buffer had displayed no change (average of all cells in each field of view, n = 8 fields of view, error bars are the standard error of the mean); E: CFP and YFP controls showed nonsignificant photobleaching over the time course of the experiment (average of all cells in each field of view, n = 5 fields of view, error bars are the standard error of the mean).
