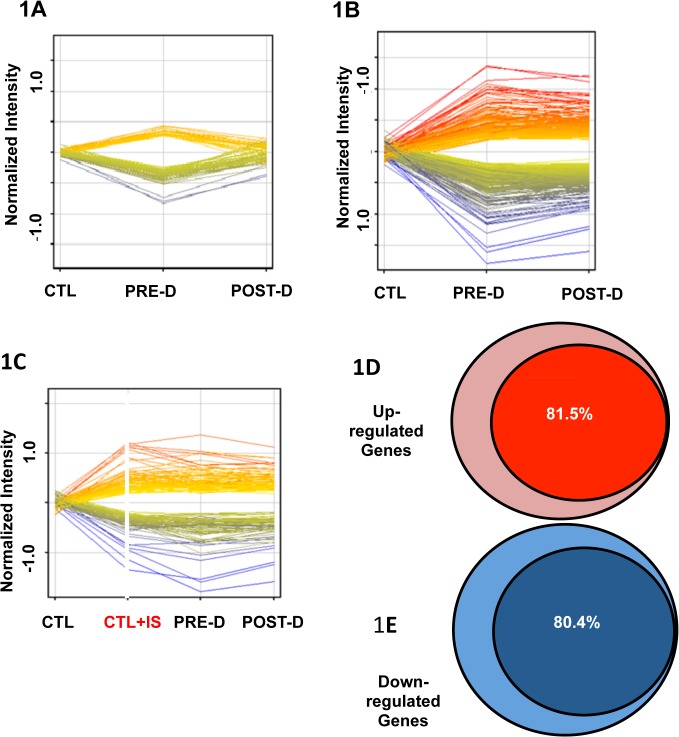
Fig 1. Gene expression in reporter renal tubular cells.
A: Genes that returned to baseline post-dialysis. Each individual line represents the average value in the 10 uremic subjects for each gene that was dysregulated. 282 genes were upregulated (displayed as yellow to red lines) and 255 genes were downregulated (displayed as green to blue lines) in the pre-dialysis samples as compared to normal controls. Post-dialysis these values returned to baseline. B: Genes that remained dysregulated after dialysis treatment. 843 genes were upregulated and 532 genes were downregulated. C: Genes expressed following incubation in normal plasma spiked with indoxyl sulfate compared with their expression levels in cells treated with pre-dialysis and post-dialysis plasma. 908 genes were upregulated and 571 genes were downregulated. D: 81.5% of upregulated genes that were not normalized by dialysis were mimicked by addition of indoxyl sulfate to normal plasma. E: 80.4% of downregulated genes that were not normalized by dialysis were mimicked by addition of indoxyl sulfate to normal plasma.

