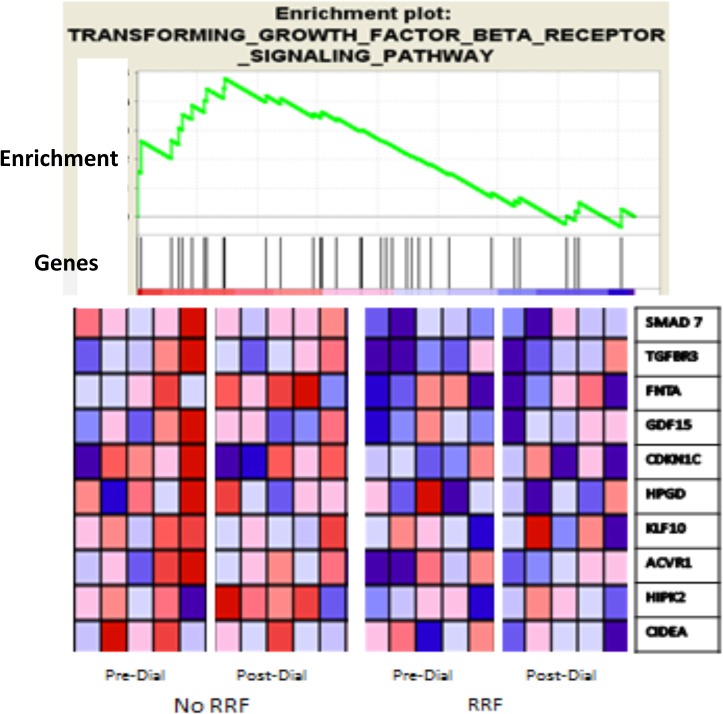
Fig 5. The expression of genes in the TGF receptor pathway identified by Pavlidis Template Matching [27] in the DAVID data base [31] and subjected to Gene Set Enrichment Analysis (GSEA) [32,33].
The 10 uremic patients were dichotomized into those without RRF (n = 5) on the left and those with RF (n = 5) on the right. The GSEA enrichment score curve (top panel) for TGF-beta receptor signaling (34 genes), indicates 10 genes as core-enriched (mapped on ranked list left of the peak on the enrichment score curve). The activation of these 10 genes was greater following incubation in pre- and post- dialysis (Pre-Dial, Post-Dial) plasma of subjects without RRF than in subjects with RRF (bottom panels, red in heat map = high mRNA abundance, blue = low abundance).

