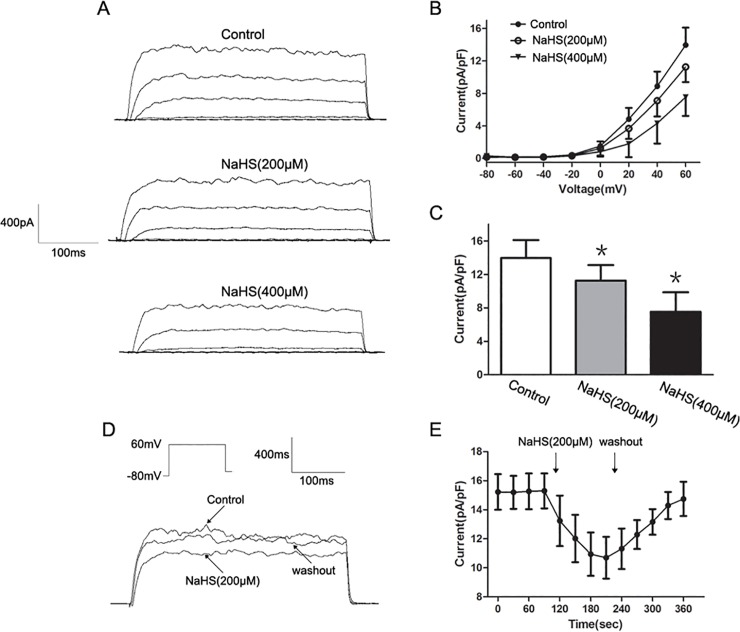
Fig 8. Inhibitory effect of NaHS on I BK,Ca.
(A) Original traces of whole cell recordings in response to a series of depolarizing voltage pulses from a holding potential of −80 mV to +60 mV in 20 mV steps before (control) and after application of NaHS (200 and 400 μM) (B) The representative effects of NaHS at different concentrations on the I-V relationship of I BK,Ca. (C) Summarized data showing the density of the currents at +60 mV. (D and E) Representative traces elicited by a single depolarized step pulse from −80 mV to +60 mV and the time course of NaHS induced inhibition on I BK,Ca (n = 8 for each group, *P<0.05 vs. control).

