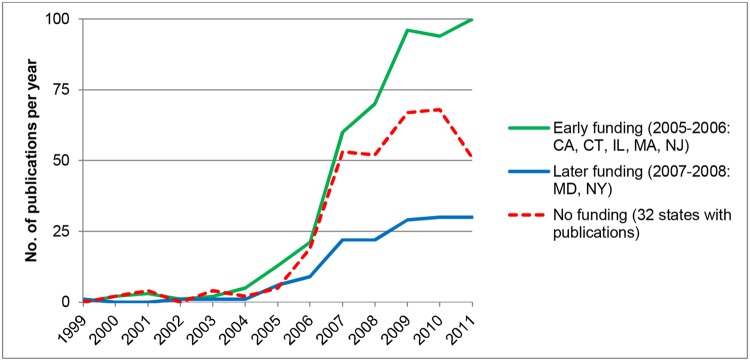
Fig 2. hESC Publication Trends in U.S. States With and Without Funding, 1999–2011.

The vertical axis in the figure reports the number of publications per year in three classes of states: States in which funding for hESC research began in 2005–2006 (green line), those in which funding began in 2007–2008 (blue line), and those that never funded hESC research (red line).
