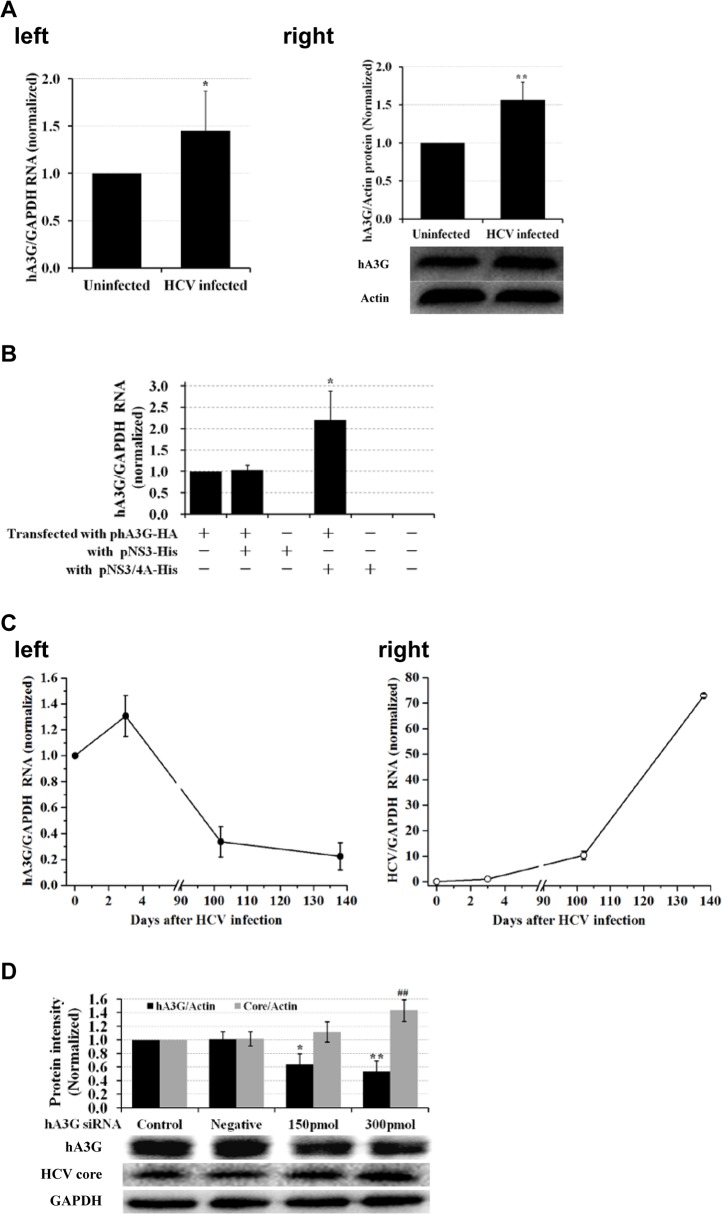
Fig 4. HCV infection caused a transient increase of intracellular hA3G.
(A) Intracellular hA3G expression was increased at either RNA (left, n = 3) or protein (right, n = 3) level in Huh7.5 cells 3 day after HCV infection. The bands presented below showed the results of a representative experiment. *P<0.05 and **P<0.01: HCV infected cells vs. uninfected. (B) Intracellular hA3G was increased by NS3/4A. Real time qRT-PCR was used to analyze hA3G mRNA in the 293T/17 cells, after 48 hrs co-transfection with phA3G-HA and pNS3-His or pNS3/4A-His. Shown was the average value (n = 3). *P<0.05: co-transfected with phA3G-HA and pNS3/4A-His vs. transfected with phA3G-HA alone. (C) Long-term culture of HCV-infected Huh7.5 cells caused a decline of the intracellular hA3G and increase of HCV in cells (left, hA3G RNA; right, HCV RNA). (D) Specific siRNA for hA3G enhanced HCV replication in HCV infected Huh7.5 cells. Density histogram showed the average values of 3 independent experiments. The bands presented below showed the results of a representative experiment. A non-relevant siRNA at concentration of 150 pmol was used as a negative control in this experiment. *P<0.05, **P<0.01 and ## P<0.01: hA3G silenced vs. control group.

