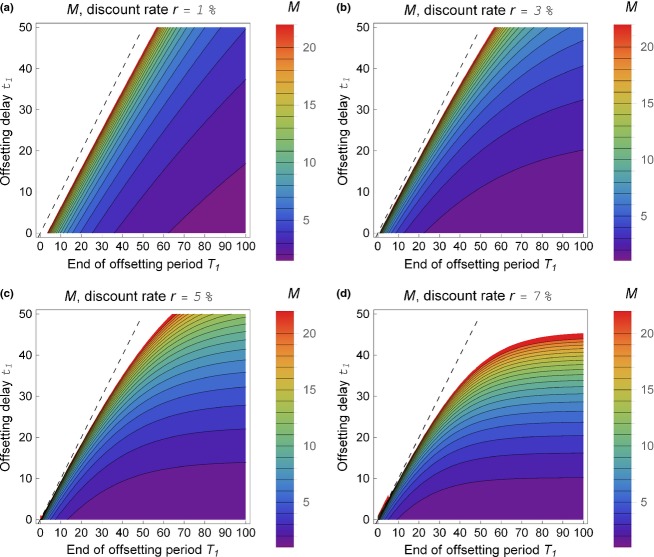
Figure 3.
Minimum multiplier M as a function of the offsetting delay t1 and the end of offsetting period T1 ≥ t1. The assumptions are same as in Fig.2, and additionally, a relative increase of 1 in condition of area A1 is assumed at time T1. The four panels include minimum multipliers for exponential time discounting of rate (a) r = 1%, (b) r = 2·0%, (c) r = 5·0% and (d) r = 7·0%. The values are only shown for the cases where T1 ≥ t1, leaving empty the part of the graph where T1 < t1 (left-hand side of the dashed line). On the right-hand side of the dashed line, the values increase and can be much higher than 20, the closer they are to the dashed line and the higher they are in the y-axis.

